Chapter 3 Introduction to R and RStudio
This is an Open Access web version of the book Practical Machine Learning with R published by Chapman and Hall/CRC. The content from this website or any part of it may not be copied or reproduced. All copyrights are reserved.
If you find an error, have an idea for improvement, or have a question, please visit the forum for the book. You find additional resources for the book on its companion website, and you can ask the experimental AI assistant about topics covered in the book.
If you enjoy reading the online version of Practical Machine Learning with R, please consider ordering a paper, PDF, or Kindle version to support the development of the book and help me maintain this free online version.
R is a free programming language and environment for statistical computing (R Core Team (2022)). R is usually used together with the Integrated Development Environment (IDE) RStudio (RStudio Team (2022)). RStudio provides a graphical user interface for coding, debugging, and testing in R. Throughout this book, R is used together with RStudio to prepare data and to process machine learning algorithms.
This chapter aims to provide the reader with the necessary R knowledge. The content will cover only R commands and functionality essential to work with the sample R code used in the book in order to keep it short and simple. For a comprehensive coverage of R, see Wickham and Grolemund (2017) and Wickham (2019).
Every beginner or intermediate user of R is strongly encouraged to thoroughly work through this chapter since it describes workflows used later when working with machine learning. Advanced R users should at least skim through the chapter to get familiar with the workflows.
Keep in mind that there is often more than one good way to solve the same problem in R. For the sake of simplicity, this chapter selects the method preferred by the author. The intention here is not to claim that this method is the best, but to show examples that are adequate and clear.
At the end of this chapter you will find two interactive sections (see Sections 3.10 and 3.11). These interactive sections contain a project and exercises together with code blocks that you can load, modify, and execute in RStudio. To understand a programming language like R, it is essential that you engage in hands-on experimentation with the language.
You can find links to Digital Resources such as videos and other resources in Section 3.12. These resources will help you to improve your knowledge of R further.
3.1 Learning Outcomes
This section outlines what you can expect to learn in this chapter. In addition, the corresponding section number is included for each learning outcome to help you to navigate the content, especially when you return to the chapter for review.
In this chapter, you will learn:
How to install R and RStudio (see Section 3.2).
How to work with the standard window layout in RStudio (see Section 3.3).
How to set up RStudio (see Section 3.3).
How to create a project (folder) in RStudio (see Section 3.3).
How to use major functionalities of RStudio (see Section 3.3).
How to extend R’s functionality with R packages, and which packages you should install for this book (see Section 3.4).
How to store different types of data in R (see Section 3.5).
How to name R variables and objects in a systematic and easy to read way (see Section 3.6).
How R displays very big and very small numerical values (see Section 3.7).
How R commands are structured (see Section 3.8).
How data processing and analysis can be streamlined using the tidyverse package (see Section 3.9).
How you can create a small project to investigate the Titanic disaster (see the interactive Section 3.10).
How you can apply what you have learned in this chapter in 14 short, interactive exercises (see the exercises in Section 3.11).
3.2 Install and Set Up R and RStudio
A typical setup to work with R consists of two components:
The R software which executes R code.
RStudio, where you can write, debug, and test R code.
These two components are two different programs. Therefore, R and RStudio need to be installed separately. It is crucial to install R before RStudio.
You can download R at: https://cran.r-project.org/bin/.
You can download RStudio at: https://www.rstudio.com/products/rstudio/download/#download.
If you have an older version of R or RStudio installed, upgrading to the latest version is strongly recommended. Use your operating system’s uninstall procedure to uninstall R and RStudio before installing the latest versions. If you do not uninstall your old R version, the new version of R will be installed parallel to your old version, which is, in most cases, undesirable.
Links to detailed installation guides are provided in the Digital Resource Section 3.12 at the end of this chapter.
3.3 RStudio the Integrated Development Environment (IDE) for R
RStudio is a software development environment that assists in writing R code in a straightforward and user-friendly way. It is the most commonly used IDE for the R language.
3.3.1 The Window Layout in RStudio
Regardless, if R and RStudio are installed on Windows, macOS, or Linux, the RStudio windows will look similar to the ones displayed in Figure 3.1.
- The lower-left window contains the R Console:
-
Here, the user can execute R code directly by typing the code. For example, the user can type 1+2 and hit the Enter key (
Returnon Mac). R then executes the code and displays 3 as the result. -
Typing code directly into the R Console is not recommended because this workflow does not take full advantage of the RStudio IDE.
- The upper-left window displays the code from R files:
-
The most commonly used files in RStudio are R script files. These files are text files and contain R code with one R command on each line. You can execute a command by placing the cursor in the respective line of the R script and hitting
CTRL-Enter(CMD-Returnon Mac). The command in the line is then executed, and the cursor moves to the next line (command). This allows you to execute an R script sequentially line-by-line by repeatedly hittingCTRL-Enter(CMD-Returnon Mac). -
When opening an R script file, it opens in the left-upper window in RStudio (see Figure 3.1). To create a new R script, you can use the RStudio menu (
File -> New File -> R Script) and then useFile -> Save As\(\dots\) to save it in your project folder (more about projects and project folders below). -
In the R script in Figure 3.1 the user typed
A=1+2and hitCTRL-Enter(CMD-Returnon Mac) while the cursor was somewhere in the first line of the R script. As a result, the code line was copied to the R Console window and executed.1+2was assigned to the variable \(A\). The second line of the R script window was executed in the same way (CTRL-EnterorCMD-Returnon Mac) to print the value ofAto the R Console window. This approach is better than typing directly into the R Console window because the code can be saved as an R script file (file extension.R) and is, therefore, reproducible.

FIGURE 3.1: The RStudio Windows
- The lower-right window contains the Files tab:
-
This tab displays all files available in a project folder (see Figure 3.1). In the same window, you can choose different tabs. For example, you can display R plot output (tab
Plots) or a list of installed packages (tabPackages). - The upper-right window contains the Environment tab:
-
This tab displays the content of R objects. Initially empty, but when a user assigns content like a number to an R object, the object and its content are displayed in the Environment tab in the upper-right window. For example, after the user assigned
A=1+2to the R objectA, the entryA: 3is shown in the Environment tab (see Figure 3.1). -
When an R object is more complex, such as a data frame (more about data frames in Section 3.5.2), the user can click on it, and RStudio will open it in a separate window.
3.3.2 RStudio Configuration
Using the RStudio menu (Tools -> Global Options), you can configure RStudio in many ways. We recommend being conservative with changing options when you are not absolutely sure about the consequences.
However, it is strongly recommended to change the following settings:
Use
Tools -> Global Options, and then disableRestore .RData into workspace at startup.Set the option
Save workspace to .RData on exit.to Never.
Saving the R workspace (the content of all R objects) when closing an R session is not necessary when working with R scripts because all R objects can be re-created with a few clicks as long as the R script has been saved before. Keeping R workspaces between R sessions can lead to confusion and errors. Note that setting the Global Options as described above needs only to be done once for any given RStudio installation.
Another good practice is to assign a specific hard drive folder to each data science project. You decide what you consider a project. Afterward, all files will always be saved into the specified R Project Folder.
When you work with that project, RStudio will save and load all files from/into this project folder by default.
You mark a folder as an R Project Folder by creating an R Project using the RStudio menu. Assuming the folder already exists, you can create an R Project for this folder with File -> New Project ... -> Existing Directory.4 Creating an R project ensures that R will always open and save R scripts or data files from and into this folder, respectively. In addition, when resuming work on a project, one can open a recently used R Project with just a few clicks (File -> Recent Projects). This is faster and more convenient than navigating through the directory tree with a file explorer tool. Another advantage is that all related files are shown in the Files tab in the lower-right window after the project opens.
At the end of this chapter, in the Digital Resources section 3.12, a 5-minute video details the procedure to create a project.
3.4 R Packages
R provides many functionalities for statistical research, including tools to organize and clean data, visualize data, and run machine learning algorithms. If all of these commands were loaded into memory at startup, the R program would require a lot of computer memory. To avoid this, R comes only with minimal functionality when first installed. Then, the user can add R packages, which provide additional functionality. This way, in any given R session, only functionality required for the particular data science project is loaded.
To use an R package, two steps are required:
The new package has to be downloaded from the CRAN server (Comprehensive R Archive Network) and saved on your computer’s hard drive. This only needs to be done once for each R installation. To download and install a package on your hard drive, click
Toolsin the menu bar and chooseInstall packages\(\dots\). Then, enter the package name into the entry field and leaveInstall Dependencieschecked. This way, all other packages that your new package depends on are also automatically downloaded and saved.Allthough you can also download packages from other repositories, packages provided through CRAN are authoritative because they are peer-reviewed and tested before being available on CRAN. Thus, the chance of downloading a low-quality or malicious package is low.
Before working with a package, it must be loaded into the R memory by executing the
library()command. Thelibrary()command for each package needs to be executed only once for each R session. It is good coding practice to place alllibrary()commands at the beginning of an R script.Below is an example of how the
tidyverse, therio, thejanitor, and thetidymodelspackages can be loaded after they have been installed on the user’s hard drive:It is good programming practice to only load those packages into an R script that are needed to execute the code of the script.
Frequently used R packages in this book are listed below:
The
tidyversepackage (Wickham et al. (2019)) supports easy and straightforward data processing. It is the most commonly used R package.The
riopackage (Chan et al. (2021)) allows to load various data formats with oneimport()command. Files can be loaded from the user’s hard drive or the Internet.The
janitorpackage (Firke (2023)) provides functionality for cleaning and renaming variable names to avoid spaces and special characters.The
tidymodelspackage (Kuhn and Wickham (2020)) streamlines data engineering and machine learning tasks.The
kableExtrapackage (Zhu (2021)) renders tables in HTML or PDF formats.The
learnrpackage (Aden-Buie, Schloerke, and Allaire (2022)) is needed together with theshinypackage (Chang et al. (2022)) for the interactive projects and exercises in this book.The
shinypackage (Chang et al. (2022)) is needed together with thelearnr(Aden-Buie, Schloerke, and Allaire (2022)) package for the interactive projects and exercises in this book.
The author strongly recommends installing the packages listed above immediately. This way, when a package is used later in a specific chapter, it can be loaded into memory with library() without downloading it first. Installing the packages does take a while (be patient), but it only needs to be done once.
3.5 How R Stores Data
Every programming language needs containers to store and retrieve data. R uses R objects for this purpose, and it is essential to understand the concept of R objects to be able to use R with this book.
R objects are very similar to variables in algebra. Like a variable in algebra, an R object is a container that can store data such as numerical values and retrieve them when needed. However, in contrast to variables in algebra, an R object stores not only numerical values. It can also store letters and words (characters), data plots, and even the settings and results of complete machine learning models. This capacity of being able to store much more than only numerical values makes an R object an object, rather than a variable.
R Objects are Containers to Store Various Content
R objects are very similar to algebra variables. R objects are like containers that can store various types of content such as:
- various Data Types,
- plots,
- empirical models,
- and other more advanced content.
In the following sections, you will learn about Data Types that R supports and about R objects that R uses to store data.
Understanding both concepts is important because some of the machine learning algorithms we will cover in the following chapters will only accept specific Data Types and Data Objects as data input.
The two concepts Data Types and Data Objects can be distinguished as follows:
- Data Types
-
determine what is stored. Examples include
numericalvalues, characters, andlogicalvalues (see Section 3.5.1 for more details). - Data Objects
-
vary in the way data is stored. Examples include storing data as single values, as vectors, or as data frames (see Section 3.5.2 for more details).
3.5.1 R Data Types
To reiterate, Data Types determine which type of information is stored. In order to keep it simple, we will cover only the most commonly used R Data Types:5
Numerical data type (
num)Character data type (
chr)Logic data type (
logic)Factor data type (
factor)
Numerical Data Type (num):
The numerical data type stores numerical values. Numerical values are used when performing any type of arithmetic calculation. In contrast, ZIP codes are not numerical because they are usually not used for calculations. Numerical values can be discrete (integer) or continuous (double). Note that the distinction between integer and double is not very important for this book, but you should know that integer and double values are both numerical values.
Character Data Type (chr):
In R, an object that provides for storing a sequence of characters, numbers, and/or symbols that sometimes form a word or even a sentence is called a character data type. Examples include first or last names, street addresses, or ZIP codes. The latter could also be stored as a numerical data type, which is bad coding practice but will not cause problems in most cases.
Note that what is called a character in R is often called a string in other programming languages.
You must surround character Data Types with quotation marks to distinguish them from object names. For example, if you want to assign the characters “Hello world!” to an R object called MyText, you must write it as shown in the R code block below:
## [1] "Hello world!"In the example above, the print() command was used to output the object value of the MyText object to the Console.
Note that the object name MyText in the R code block above is not in quotes, but the string Hello world! is surrounded by quotes.
Forgetting the quotes for characters is a common beginner mistake in R, but fortunately, R throws an error that points the user in the right direction when quotes are missing. You can see this in the example below where we purposely left out the quotes around Hello:
R complains by outputting the error message “Error: object ‘Hello’ not found” and that is correct because no object named \(Hello\) was ever defined. Instead, we should have assigned the character value “Hello” to the R object called MyText!
Rather than printing an R object containing a text as it was done above, we can alternatively print directly with print("Hello world!") or we can use the cat() command that allows us to print a combination of objects and text separated by comma(s):
## The content of the character object is: Hello world!The cat() command above concatenates the character value “The content of the character object is:” with the content of the R object MyText and automatically adds a space character between them.
Logic Data Type (logic):
In R, a data type that stores the logic states TRUE and FALSE, is called a logic data type.6 Different logic data type objects can be combined using “and” (&) and “or” (|). See, for example, the Truth-Table displayed in Table 3.1, which shows how pairs of True and False assigned to the R objects \(A\) and \(B\) are evaluated when connected with “and” (&) and “or” (|).
| A | B | A&B | A|B |
|---|---|---|---|
| TRUE | TRUE | TRUE | TRUE |
| TRUE | FALSE | FALSE | TRUE |
| FALSE | TRUE | FALSE | TRUE |
| FALSE | FALSE | FALSE | FALSE |
Internally, R stores a value of \(1\) for TRUE and a value of \(0\) for FALSE. This allows calculations on logical data, such as TRUE+FALSE+TRUE, which evaluates to 2. If this confuses you, don’t worry. It will become clear when we work with R code and Logic values later in Section 3.12.
We could also store variables that are either TRUE or FALSE as numerical variables, such as \(1\) for TRUE and \(0\) for FALSE. Although this is done more often than not in data science research, it is not best practice to do so.
Factor Data Type (factor):
A factor is an R data type that stores categorical data in an effective way. To understand what a factor is, we must first understand what categorical data are. For instance, first or last names are not categorical data because there are a vast number of different first or last names. As explained before, they are stored as character data.
In contrast, categorical data usually have only a (very) limited amount of variations. For example, the categorical R object MarriageStatus can be limited to “Never Married”, “Married”, “Widowed”, or “Divorced”. Because only a limited number of categories are available (four different categories in the example), we call MarriageStatus an R object that stores categorical data.
Although categorical data can be stored as character data type, it is more efficient to store categorical data as a factor. R will internally assign \(1\) for “Never Married”, \(2\) for “Married”, \(3\) for “Widowed”, and \(4\) for “Divorced” (\(1\), \(2\), \(3\), and \(4\) are called levels in R). Next, R will internally store the coding of the level and save the actual data just as \(1\), \(2\), \(3\), and \(4\). This will save memory because “1” takes less memory than “Never Married”, \(2\) less than “Married”, and so forth. It all happens behind the scene, and the R user normally needs not to be bothered about it.
There are also other reasons to use the factor data type besides memory. The main reason is that a factor data type signals R that the R object stores categorical data, which often require special treatment. This will become important later when we work with classification problems in machine learning algorithms. These algorithms usually require a factor as an outcome variable.
3.5.2 R Object Types
Now that we know the main Data Types of R, we can start exploring how these Data Types are stored in various R objects. The list of possible R object types is very long because every R package developer can design their own R object type. However, throughout this book, we will use only a few different types of R objects, and we will present some of them here:
Objects that Store a Single Value:
R can store a single value of type numerical, character, or logic in an R object by assigning the value to the object. Assigning values to R objects can be done either with an “=” or the “<-”-sign. Both are equivalent in functionality, while only the latter is correct in a mathematical sense. Nevertheless, we will use the “=”-sign throughout this book to assign data to R objects for simplicity.
Below are a few examples:
Vector-Objects:
In R, a vector object can store a sequence of elements of the same data type such as a sequence of character, numerical, or logical values, but a mix of different Data Types in a single vector is not allowed.7
The command c() (c stands for combine) can be used to assign values to an R vector object. Below are a few examples related to the weather forecast for the next three days:
We can use a command such as mean() to calculate the mean of a vector with numerical Data Types or the command length() to calculate the number of entries in a vector:
## The average forecasted temperature is 64.33## The forecast is for 3 days.Data Frame Object:
R can store a complete data table with rows and columns in an object. We refer to such a data table as a data frame object.
A data frame is very similar to an Excel table. The first row of a data frame defines the names of the variables that are stored in the columns — similar to a title row in Excel. The following rows of a data frame (starting with row two) contain the values for the observations stored in the data frame. Each row is one observation.
Each data frame column contains a named variable related to the observations. The variable’s name is the first entry in the column, and the related values are stored in the following entries. These values can be of various Data Types such as char, numeric, or factor — you can have different Data Types for different columns. However, each column can have only one data type.
You can think of a data frame as a combination of R vectors arranged in the data frame’s columns. In fact, you can extract a data frame column as a vector by combining the data frame name and the column name (the variable name) — separated with a “$”-sign.

FIGURE 3.2: Screenshot of the View() Window
Let us use the famous Titanic dataset as an example of how to work with data frames: Figure 3.2 displays five observations from the data frame DataTitanic. We used the import() command from the rio package to load the Titanic dataset from the Internet and assigned it to data frame DataTitanic:8
## Warning: package 'rio' was built under R version 4.3.3The content of Figure 3.2 was created with View(DataTitanic). The View() command can only be used in the Console of RStudio. It is a very useful command as it displays a complete scrollable view of a data frame.
Figure 3.2 reflects what you learned about data frames:
The first row contains the names of the variables that are related to the observations (passengers).
The variable \(Name\) is a
charactervariable, \(Sex\) is a categorical variable (with categories male and female).9 All other variables are numerical variables.10
- The observations (here: the first five passengers) are in the rows (starting with Row 2).
We can extract the \(Age\) variable as an R vector object and then use the mean() command to calculate the average age of the Titanic passengers:
## [1] 29.47In the last line of the code block above, we did not assign the output of the mean() command to an R object. Output not assigned to any object will be outputted to the Console. As you can see, the average age of Titanic passengers was 29.47.
You can also find out how many passengers are considered in the data frame DataTitanic, as this coincides with the number of rows (observations) of DataTitanic. You can apply the length() command to any vector from the data frame DataTitanic to find the number of rows, as follows:
## Number of observations: 887You cannot apply the length() command directly to a data frame, but you can find the number of rows (the number of observations) directly from a data frame with:
## Number of observations: 887In the two code blocks above, we nested the length() and the nrow() commands within the cat() command to generate a more informative output. In general, you are free to nest R commands into each other to any level you choose, but the readability of your code might suffer.
R data frames come in two varieties: i) original data frames from base R, which are called data frame and ii) a slightly more advanced version from the tidyverse package called a tibble. In older versions of R (before Version 4.0), there were quite a few differences between the two versions, but currently, the base R data frame object has been significantly improved, and both object types are almost identical. Therefore, we will treat the base R data frame object and the tibble object synonymously throughout this book.11
Later in this chapter, we will work with the Titanic dataset again. For now, it is essential to remember that data frames consist of columns representing variables (with the variable names in the first row) and rows representing the observations in the second and following rows. We can extract a variable as a vector by combining the data frame name with the variable name, separated with a “$”-sign.

FIGURE 3.3: Data Objects and Data Types
When working in the RStudio environment, the content of a data frame can be displayed by clicking on the icon next to the data frame’s name in the environment tab of the upper-right RStudio window. This opens a separate window that allows scrolling and sorting of the data frame.
Advanced Objects:
Advanced objects in R include R objects such as plot-objects or model-objects. These more complex objects typically contain instructions, data, results from statistical models, and more. We usually do not have to deal with details of these objects and leave it to the R program to process them appropriately. However, we will introduce commands to extract specific information from advanced objects later in Chapter 5.
3.6 Naming Rules for R Objects
After discussing different R objects, the remaining question is, are there any rules for naming these objects when writing code.
Based on your experience with high school math, you might tend to write object names with a single character, such as X or Y. You are free to do this in R, and in some cases it might be a good choice. However, using multiple letters for object names is recommended in most cases, as this makes your code more readable. How long your object names should be is a matter of style and taste. Too long convolutes your code; too short is not descriptive enough.
In any case, it is recommended to follow the rules that are listed below:
An object name must start with a letter (mandatory) and no special characters such as space, “%”, “$”, “.”, “_”, or “#” should appear in object names unless required by the R syntax. The reason not to use special characters in object names is that some of these special characters have a distinct meaning in R, and some are reserved for use with specific packages.
An object name should start with a capital letter, and the following letters are lowercase until a new word begins with a capital letter, regardless of what English grammar suggests. This type of capitalization is called UpperCamel-notation. There are reasonable alternatives13 to UpperCamel, but for consistency reasons, we use UpperCamel to name objects throughout the book. Below is an example:
- In what follows, the first part of an R object name will indicate the object type such as Data in
DataStocks, Vec inVecLong(for a vector), Plot inPlotVarXY(for a plot object), or Model inModelOLS(for the results from a model). If applicable, we will also startlogicR objects with the wordIsto indicate that we are working with a condition (e.g.,IsWeatherGood=TRUE). These rules are not required, but they make the code easier to read.
3.7 How R Displays Very Big and Very Small Numbers
Sometimes in data science projects, we work with very big numbers and also very small numbers. For example, at the writing of this book, the 2022 GDP (current dollars) of the U.S. is estimated to be $25.5 trillion or $25,500,000,000,000.
An example of a very small number is the chance of being struck by lightning: The probability of getting struck by lightning in the U.S. is about \(0.00000000365\) on any randomly chosen day.14
How should we work in R with such big or small numbers? Obviously, using them as they are, is not a good option. Instead, we can express numbers in scientific notation.
Let us start with the big GDP number: We could write the GDP as a number with one leading digit and state how many digits the decimal point should be moved to the right. Such as:
\[2.55; \mbox { move decimal point 13 digits to the right}\]
This method might be a little better than writing out a big number, but it is not well suited for calculations. However, if we consider that moving the decimal point one decimal to the right is the same as multiplying by 10, moving it two digits is the same as multiplying by 100, and three digits is equivalent to a multiplication by 1000, and so on. Then we can write the GDP as:
\[\begin{eqnarray*} GDP&=&2.55 \cdot 10,000,000,000,000\\ &\Longleftrightarrow&\\ GDP&=&2.55 \cdot 10\cdot 10\cdot 10\cdot 10\cdot 10\cdot 10\cdot 10\cdot 10\cdot 10\cdot 10\cdot 10\cdot 10\cdot 10 \\ &\Longleftrightarrow&\\ GDP&=&2.55 \cdot 10^{13} \end{eqnarray*}\]The last equation writes the big GDP number in scientific notation.
We can do the same for very small numbers. For example, the probability of getting struck by lighting. In this case, we move the decimal point to the left because we work with a very small number. This can be done through division by 10 for one digit, by division by 100 for two digits, and so on:
\[\begin{eqnarray*} ProbLight&=&3.65; \mbox { move decimal point 9 digits to the left}\\ &\Longleftrightarrow&\\ ProbLight&\frac{3.65}{10\cdot 10\cdot 10\cdot 10\cdot 10\cdot 10\cdot 10\cdot 10\cdot 10} \\ &\Longleftrightarrow&\\ ProbLight&=&\frac{3.65}{10^9}\\ &\Longleftrightarrow&\\ ProbLight&=&3.65 \cdot 10^{-9} \end{eqnarray*}\]In summary, we can write both \(GDP\) and \(ProbLight\) in scientific notation as done below:
\[\begin{eqnarray*} GDP&=&2.15 \cdot 10^{13}\\ ProbLight&=&3.422 \cdot 10^{-9} \end{eqnarray*}\]What does R do when we present it with these very big and very small numbers?
## GDP: 2.15e+13## ProbLight: 3.65e-09R uses almost scientific notation except for substituting the “10 to the power of \(\dots\)” with the lowercase letter \(e\). This notation is not very pretty, and it is certainly not mathematically correct, but almost all statistical programs use this pseudo-scientific notation.15
What did you learn? When you see R output for very big or small numbers, you know now how to interpret the number following the letter e. This number tells you how many digits you have to shift the decimal point to the right (when the number is positive) or to the left (when the number is negative).
3.8 The Structure of R Commands
When working with R commands and especially when combining several R commands (piping; see Section 3.9.4), it is crucial to understand the principle structure of R commands.
As you have already seen, in commands like mean() or sum(), an R command consists of the command’s name followed by a pair of parentheses. Inside the parentheses, the user can provide information for one or more arguments for the command.
In the example below, we again extract the age of the Titanic passengers from the data frame DataTitanic and store it in the R vector object VecAge (see Section 3.5.2 for more details). Then we use the mean() and the median() commands to calculate mean and median age of Titanic passengers:
library(rio)
DataTitanic=import("https://ai.lange-analytics.com/data/Titanic.csv")
VecAge=DataTitanic$Age
cat("Mean:", mean(x=VecAge))
cat("Median:", median(VecAge))
## Mean: 29.47## Median: 28The two examples above already reveal some important properties regarding the structure of R commands:
Each argument in a command has a name. For example, the name for the data argument in the
mean()andmedian()commands isx, like in many other commands. Note thatxanddataare common names for the data argument in R commands.x=VecAgeassigns the data from the RvectorobjectVecAgeexplicitly to thexargument.R does not require the user to use the arguments’ names as long as the values for the arguments are provided in the correct order. For example,
xis the first argument for both themean()andmedian()commands. Therefore,median(VecAge)is sufficient to assignVecAgeto thexargument.Almost all R commands have more than one argument, each of which has a unique name. This is also true for the commands
mean()andmedian(). However, you can see that only one argument was provided in the two examples above. This is possible because R uses default values if the user does not provide values for all arguments.As mentioned earlier, we can nest commands. In the examples above, you can see that the commands
mean()andmedian()are nested into the commandcat(). R allows for nesting commands to any depth. But nesting commands too deeply can make the code very difficult to read.
Let us look at the median() command in more detail. When we type ? median() in the Console window of RStudio, a help file is displayed in the Help-tab of RStudio in the lower-right window. Besides other help topics, we get information about a command’s arguments, their order, and default values:
median(x, na.rm = FALSE, ...)
In this case, the command median() has two arguments: One argument called x without a default value, which means the user must assign the data to x, and a second argument named na.rm. The latter determines if missing values are removed automatically before calculating the median. The default na.rm=FALSE means that missing values are not automatically removed. However, the user can set na.rm=TRUE, for example with:
Alternatively, the user can omit the argument names as long as the values of the arguments are in the correct order:
As a rule of thumb: In most R commands, the data argument is the first argument. This rule of thumb will help us later when we connect multiple R commands (using piping) in Section 3.9.4.
3.9 Data Wrangling with the tidyverse Package
Like a herd of cattle, data usually do not come as organized as we wish. As a result, we have to perform what is called data wrangling to clean and organize messy data to prepare them for analysis.
The tidyverse package16 is by far the most used and powerful package in R for data wrangling and other data related tasks. The goal of the tidyverse package is to streamline and standardize the R data analysis workflow.
The tidyverse package is a meta package that includes about 30 other packages, including the dplyr, ggplot2, magrittr, and the tibble packages, to name a few. All these packages are installed automatically when the user installs the tidyverse. Likewise, when the tidyverse is loaded with library(tidyverse), all containing packages are loaded automatically.
The following sections will focus on the tidyverse commands required for this book’s R analysis. Related videos are listed in the Digital Resources section at the end of this chapter (see Section 3.12).
The reader is encouraged to study more about the tidyverse packages and commands. A comprehensive book by the primary author of the tidyverse is available as a paperback book and freely on the Internet.17
3.9.1 Select Data
With the select() command, you can select variables (columns) from a data frame. This is useful if you do not need all variables from a data frame and want to create a new data frame with less variables.
The first argument in the select() command is the name of the data frame you are working with. The other arguments (separated by commas) are the variables you like to select.
In the example below, we load the tidyverse and the rio packages,18 import the complete Titanic dataset from the Internet, and use the select() command to assign a subset to a new data frame called DataTitatinicNarrow. The new dataset should only contain the variables (columns) \(Survived\), \(Pclass\), \(Sex\), \(Age\), and the \(FareInPounds\). Then, using the head() command, we print the first six observations of the data frame DataTitanicNarrow to the Console:
library(tidyverse);library(rio)
DataTitanic=import("https://ai.lange-analytics.com/data/Titanic.csv")
DataTitanicNarrow=select(DataTitanic, Survived, PasClass=Pclass,
                         Sex, Age, FareInPounds)
head(DataTitanicNarrow)
## Survived PasClass Sex Age FareInPounds
## 1 0 3 male 22 7.250
## 2 1 1 female 38 71.283
## 3 1 3 female 26 7.925
## 4 1 1 female 35 53.100
## 5 0 3 male 35 8.050
## 6 0 3 male 27 8.458As you can see, we were successful. The data frame DataTitanicNarrow contains only the five selected columns.
We also renamed a variable. Since the variable \(Pclass\) in the downloaded original dataset did not comply with our UpperCamel standards, we used PasClass=Pclass to first select \(Pclass\) and then rename it to \(PasClass\).
You can also override an existing Dataframe with the output of the select() command, as shown in the example below:
library(tidyverse);library(rio)
DataTitanic=import("https://ai.lange-analytics.com/data/Titanic.csv")
DataTitanic=select(DataTitanic, Survived, PasClass=Pclass,
                   Sex, Age, FareInPounds)
In most cases, overwriting a data frame is not advised. You can see the problem here: If, for whatever reason, the above select() command gets executed a second time, we would get an error message because we try to select and rename \(Pclass\), but \(Pclass\) does not exist anymore in DataTitanic. It was renamed before, when we executed the select() command the first time.
3.9.2 Filter Data
When we used the select() command, we chose which variables (columns) to include in the resulting data frame. In contrast, the filter() command filters for observations (rows) in a data frame that fulfill specific criteria.
As with the select() command, the first argument of the filter() command is the data frame that the command processes. Then, one or more conditions specify which observations should be chosen.
In the examples below, we demonstrate a few applications of filter(). For this, we use the data frame DataTitanicNarrow that we created using the select() command:
Analyzing only male passengers:
If we only want to analyze the male passengers and then save the results in a new data frame, DataTitanicMen, we can use:
##   Survived PasClass  Sex Age FareInPounds
## 1        0        3 male  22        7.250
## 2        0        3 male  35        8.050
## 3        0        3 male  27        8.458
## 4        0        1 male  54       51.862
## 5        0        3 male   2       21.075
## 6        0        3 male  20        8.050
In the code block above, when we filtered for male passengers, we used Sex=="male" as a condition. This condition could be translated to: “the variable \(sex\) is required to be male”.
Please note the following two technicalities:
We used
==instead of=. This is required in R and in most other programming languages because==indicates a condition rather than an assignment. Forgetting the second “=”-sign in the condition is a common mistake. Fortunately, R gives a distinct error message when this happens.The word “male” must be written in quotes because the condition requires that the variable \(Sex\) equals the
char-value “male” and not the objectmale.
Analyzing only passengers with low fares:
To filter the data frame for passengers with a fare below and then save the results in the new data frame, DataTitanicLowFare, you can use the following R code:
##   Survived PasClass  Sex Age FareInPounds
## 1        0        3 male  45        6.975
## 2        0        3 male  19        6.750
## 3        0        3 male  36        0.000
## 4        0        3 male  34        6.496
## 5        0        1 male  40        0.000
## 6        1        3 male  25        0.000
If you look carefully at the output above, you can see that it includes fares that are \(0\). These are most likely observations with missing fares. Ideally, these \(FareInPounds\) entries should be NA (not available), but in this dataset, they are \(0\). Therefore, we can throw out these observations by adding a second condition in the filter() command and combining the two conditions with an & (and):
DataTitanicLowFare=filter(DataTitanicNarrow,
                          FareInPounds<7 & FareInPounds>0)
head(DataTitanicLowFare)
## Survived PasClass Sex Age FareInPounds
## 1 0 3 male 45 6.975
## 2 0 3 male 19 6.750
## 3 0 3 male 34 6.496
## 4 0 3 male 61 6.237
## 5 0 3 male 18 6.496
## 6 0 3 male 20 4.013You can see that now the output contains no observations with \(0\) fare.
Analyzing only passengers 60 years and older (seniors):
To analyze only passengers with an age of 60 or greater and then save the results in the new data frame DataTitanicSeniors, we can use the following R code:
##   Survived PasClass  Sex  Age FareInPounds
## 1        0        2 male 66.0        10.50
## 2        0        1 male 65.0        61.98
## 3        0        1 male 64.0        27.72
## 4        0        1 male 71.0        34.65
## 5        0        3 male 70.5         7.75
## 6        0        1 male 60.0        25.93
Note, the output contains only passengers with age 60 and older. We used >= in the condition instead of > to accomplish this. This ensured that passengers with \(Age=60\) were included in the output.
3.9.3 Mutate (Calculate) New Variables in a Data Frame
The mutate() command provides something very similar to what we often do in Excel: We have an Excel table with data and want to add an extra column calculated based on one or more existing columns.
Based on a data frame, mutate() calculates a new variable (column) based on existing variables (columns). A command name like calculate rather than mutate() would likely better show what the command actually does, but the name is what it is — mutate().
Here is an example: The \(FareInPounds\) in the Titanic dataset reflects prices of 1912 in British pounds. How much are these prices in 2023 U.S. dollars? To get an approximate value, we have to multiply the British pound prices from 1912 by 108.519
Here are the detailed steps:
We need to create a new data frame
DataTitanicNewFarethat contains a new variable (column) \(FareIn2023Dollars\) based on the data frame \(DataTitatanicNarrow\).The new variable (column) \(FareIn2023Dollars\) is defined as:
\(108.5*FareInPounds\).It would also be nice to delete the column \(FareInPounds\) afterward, as it is no longer useful.
We can accomplish all this with the mutate() command:
The first argument of the
mutate()command is (again) the data it operates on (DataTitanicNarrow).The following arguments determine how to calculate new variables and update existing variables.
Subsequent definitions are separated by commas.
The related R code and the output showing the new data frame is displayed below:
DataTitanicNewFare=mutate(DataTitanicNarrow,
                          FareIn2023Dollars=108.5*FareInPounds,
                          FareInPounds=NULL)
head(DataTitanicNewFare)
## Survived PasClass Sex Age FareIn2023Dollars
## 1 0 3 male 22 786.6
## 2 1 1 female 38 7734.2
## 3 1 3 female 26 859.9
## 4 1 1 female 35 5761.4
## 5 0 3 male 35 873.4
## 6 0 3 male 27 917.7Note, we assign NULL to the existing variable FareInPounds, deleting it from the data frame (the assigned value NULL makes the variable non-existent). As you can see, mutate() also allows updating and overwriting a variable with a new formula.
3.9.4 Linking R Commands Together with Piping
Piping is a procedure that links one or more R commands together. Piping pushes the output of one command as input to the following command. The piping operator |> connects the different R commands.
We will demonstrate how piping works with an example: Assume that based on the data frame DataTitanic, we would like to create a new data frame named DataFinalResult that contains:
only the variables \(Survived\), \(Sex\), \(Age\), and \(FareInPounds\)
only female passengers, and
the fare passengers paid should be expressed in 2023 dollars in a new variable \(FareIn2023Dollars\).
As you learned already, for the first condition, you would use the select() command to select the required variables. Next, ensuring your result contains only female passengers, you would use filter() to filter your observations for female passengers. And finally, to ensure the fare is expressed in 2023 dollars, you would use mutate() to calculate the correct fare.
As explained in Section 3.8 most R commands have the following structure with the data arguments as the first argument:
\[ \underbrace{command}_{\text{Command Name}} (\underbrace{\overbrace{Arg1}^{\text{Data}}, \overbrace{Arg2, Arg3, \dots, ArgN}^{\text{More Arguments}}}_{\text{Arguments Separated by Comma}}) \]
This command structure will help us when piping the commands select(), filter(), and mutate() together.
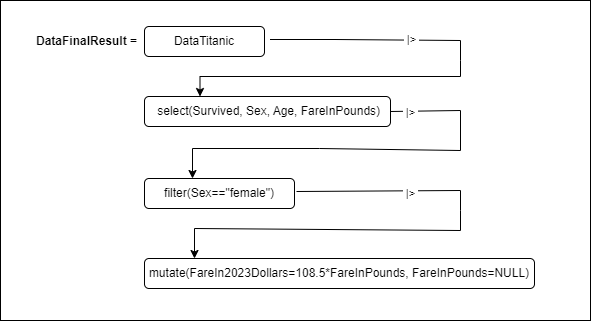
FIGURE 3.4: Piping in a Flowchart
The idea behind piping is displayed for our example in Figure 3.4:
Left of the “=”-sign is the data frame that will eventually contain the result (
DataFinalResults).The right of the “=”-sign starts with the name of the data frame that is processed:
DataTitanic.The piping operator
|>pushes the data frameDataTitanicas the value for the first argument into theselect()command. Consequently, the first argument in theselect()command — the data argument — is omitted.The output of the
select()command is a data frame containing only the variables \(Survived\), \(Sex\), \(Age\), and \(FareInPounds\).The piping operator
|>then pushes the output of theselect()command into thefilter()command as the value for its first argument (dataargument). Therefore, thedataargument itself is omitted infilter().The
filter()command filters for female passengers and creates an all female data frame.The all-female data frame is pushed by the piping operator
|>as the first argument into themutate()command.The
mutate()command finally generates the new variableFareIn2023Dollarsand deletesFareInPounds.The output of the complete pipe is then assigned to the data frame
DataFinalResult.
Following the flow chart in Figure 3.4, it is not difficult to generate the R code for our task:
library(tidyverse);library(rio)
DataTitanic=import("https://ai.lange-analytics.com/data/Titanic.csv")

DataFinalResult=DataTitanic |>
                select(Survived, Sex, Age, FareInPounds) |>
                filter(Sex=="female") |>
                mutate(FareIn2023Dollars=108.5*FareInPounds,
                       FareInPounds=NULL)
head(DataFinalResult)
## Survived Sex Age FareIn2023Dollars
## 1 1 female 38 7734.2
## 2 1 female 26 859.9
## 3 1 female 35 5761.4
## 4 1 female 27 1208.0
## 5 1 female 14 3262.7
## 6 1 female 4 1811.9Instead of writing the pipe in one long line, we added a line break after each |> and indented so that the select(), filter(), and mutate() commands are lined up. This is not required but makes the code very easy to read. Note, R does not allow the piping operator to be at the beginning of a line!
The readability of the code is the reason that we use piping whenever possible for the remainder of the book. The code block below shows how much more difficult it is to read code without piping. Note that we do not override data frames in the code below because this can cause errors when executing a code line again or reusing a data frame.
library(tidyverse);library(rio)
DataTitanic=import("https://ai.lange-analytics.com/data/Titanic.csv")
DataTitanicNarrow=select(DataTitanic, Survived, Sex, Age, FareInPounds)
DataTitanicFemale=filter(DataTitanicNarrow, Sex=="female")
DataFinalResult=mutate(DataTitanicFemale,
                       FareIn2023Dollars=108.5*FareInPounds,
                       FareInPounds=NULL)
head(DataFinalResult)
## Survived Sex Age FareIn2023Dollars
## 1 1 female 38 7734.2
## 2 1 female 26 859.9
## 3 1 female 35 5761.4
## 4 1 female 27 1208.0
## 5 1 female 14 3262.7
## 6 1 female 4 1811.9As you can see, the result is the same. However, the code above is not as easy to read as the piping code, and two intermediate data frames, DataTitanicNarrow and DataTitanicFemale, were created.
To generate the piping operator in RStudio, you can use the CTRL-SHIFT-M shortcut in Windows (CMD-SHIFT-M in Mac).
3.10 🧭A Project Using the tidyverse Package
Interactive Section
In this section, you will find content together with R code to execute, change, and rerun in RStudio.
The best way to read and to work with this section is to open it with RStudio. Then you can interactively work on R code exercises and R projects within a web browser. This way you can apply what you have learned so far and extend your knowledge. You can also choose to continue reading either in the book or online, but you will not benefit from the interactive learning experience.
To work with this section in RStudio in an interactive environment, follow these steps:
Ensure that both the
learnRand theshinypackage are installed. If not, install them from RStudio’s main menu (Tools -> Install Packages \(\dots\)).Download the
Rmdfile for the interactive session and save it in yourprojectfolder. You will find the link for the download below.Open the downloaded file in RStudio and click the
Run Documentbutton, located in the editing window’s top-middle area.
For detailed help for running the exercises including videos for Windows and Mac users we refer to: https://blog.lange-analytics.com/2024/01/interactsessions.html
Do not skip this interactive section because besides providing applications of already covered concepts, it will also extend what you have learned so far.
Below is the link to download the interactive section:
https://ai.lange-analytics.com/exc/?file=03-RAndRStudioExerc100.Rmd
3.10.1 Introduction: Was Chivalry Dead on the Titanic?
In this interactive section, you will work on a small project to determine if chivalry was dead when the Titanic sank in 191220. The background for the project is an article written by Hannah Furness (Royal Correspondent at The Telegraph).21 She cites a Swedish historian claiming, “It was ‘not true’ that women and children on board the Titanic survived thanks to the gallantry of men.” Hannah Furness also reports anecdotal evidence about men being in the lifeboats instead of women: “Over on the starboard side, it was a different story. On the last boats to leave, the majority were men.” However, Furness did not use any statistics to support her claim, although data are publicly available.
It is now your job to fill this gap. The question is:
Was the proportion of women surviving the Titanic disaster greater than the one of men?
If true, that would strongly indicate that the ultimate chivalry — dying to protect a woman’s life — was still present when the Titanic sank and that Furness’ claim that chivalry was dead in 1912 is likely incorrect.
3.10.2 Analyzing Titanic Survival Rates for Women and Men
You will use the same Titanic dataset we used before together with the tidyverse package. The Titanic dataset contains 887 observations about Titanic passengers, including variables such as a survival indicator, passenger’s sex, and the class traveled in. The dataset covers about 67% of the total passengers from the Titanic.
Below are the first six observations from the DataTitantic data frame:
library(tidyverse);library(rio)
DataTitanic=import("https://ai.lange-analytics.com/data/Titanic.csv")
head(DataTitanic)
## Survived Pclass Name Sex
## 1 0 3 Mr. Owen Harris Braund male
## 2 1 1 Mrs. John Bradley Cumings female
## 3 1 3 Miss. Laina Heikkinen female
## 4 1 1 Mrs. Jacques Heath Futrelle female
## 5 0 3 Mr. William Henry Allen male
## 6 0 3 Mr. James Moran male
## Age SiblingsSpousesAboard ParentsChildrenAboard
## 1 22 1 0
## 2 38 1 0
## 3 26 0 0
## 4 35 1 0
## 5 35 0 0
## 6 27 0 0
## FareInPounds
## 1 7.250
## 2 71.283
## 3 7.925
## 4 53.100
## 5 8.050
## 6 8.458Before writing R code, we need to develop a data analysis strategy:
- Step 1:
-
You will create a data frame,
DataAnalysis, containing only the variables \(Survived\), \(Sex\), and \(Pclass\). In addition, you will transform the variable \(Survived\) to a logic variable withTRUEandFALSEvalues, and you will rename \(Pclass\) to \(PasClass\). - Step 2:
-
You will divide the data frame
DataAnalysisinto two new data frames,DataWomenandDataMen,containing only observations for women and men, respectively. - Step 3:
-
The data frames
DataWomenandDataMenwill finally be used to calculate the survival rates of women and men.
Remember, whenever you work on a data science project, develop a detailed data analysis strategy before you start coding. Otherwise, after you have spent a lot of time coding, you might need to entirely change your code because you forgot to consider an important fact.
You will now follow the steps outlined above to write the R code for the project. Step 1 from the data analysis strategy requires, to create a new data frame DataAnalysis that only contains the variables \(Survived\) (as logic data type), \(Sex\), and \(Pclass\) (renamed to \(PasClass\)).
When you substitute the ... in the code below (note that the data frame DataTitanic has already been loaded in the background), the command head(DataAnalysis) will print the first six observations of the new data frame to the Console:
DataAnalysis= DataTitanic |>
               select(... ,... , ... = ...) |>
               mutate(Survived=as.logical(Survived))
head(DataAnalysis)
Note that in the code above, the variable \(Survived\) was converted from data type numerical to logic with the mutate() command: After as.logical() converted Survived into logical data type, the result was assigned to the variable Survived updating it with the new data type.
Step 2 from the data analysis strategy requires splitting the data frame DataAnalysis into two data frames:
DataWomenshould only contain female passengers.DataMenshould only contain male passengers.
In the code block below you can use the filter() command to generate the two new data frames (note that the data frame DataAnalysis has been loaded already in the background):
DataWomen=DataAnalysis |>
          filter(... == ...)
DataMen=DataAnalysis |>
          filter(... == ...)
head(DataWomen)
head(DataMen)
Now that you have two different data frames that either only contain male or female passengers’ observations, you are ready to calculate the related survival rates.
In the code block further below, you will calculate the female survival rate. Later, for the male survival rate, we will show you a shorter alternative.
The female survival rate \((Fem_{SurvRate})\) is defined as:
\[Fem_{SurvRate}=\frac{Fem_{Surv}}{Fem_{Total}}\] Therefore, to calculate the female survival rate, you need to find the number of female passengers that survived \((Fem_{Surv})\) and the total number of female passengers \(Fem_{Total}\). The latter is the same as the number of observations in the data frame DataWomen and can be calculated with nrow(DataWomen).
To find the number of surviving women \((Fem_{Surv})\), we can use the fact that a surviving passenger was coded with TRUE with an internal value of \(1\) and a not-surviving passenger with FALSE with an internal value of \(0\). Therefore, when we extract the variable \(Survived\) as a vector object from the data frame DataWomen and calculate the sum from this vector, we get the number of female survivors (sum(DataWomen$Survived)).
With this information, you should be ready to complete the code below to calculate the rate of female survivors (note that the data frame DataWomen has been loaded already in the background):
FemSurv=...(...$...)
FemTotal=...(...)
FemSurvRate= FemSurv/FemTotal
cat("The survival rate for wommen is:",FemSurvRate)
You could do the same for the male passengers. However, there is a shorter alternative to calculate the male survival rate (note that the data frame DataMen has been loaded already in the background):
## The survival rate for men is 0.1902Why could the mean() command be used to calculate the survival rate directly? It is because the mean is calculated by dividing the sum of a variable by the number of observations. This is what we did explicitly when we calculated the female survival rate.
When we use the cat() command to print and compare the female and male survival rates, you can see that the survival rate for female passengers is much higher than the one for male passengers:22
cat("The survival rate for women is:", FemSurvRate, "\n",
    "The survival rate for men is:", MaleSurvRate )
## The survival rate for women is: 0.742
## The survival rate for men is: 0.1902The remaining question is if the difference between the two survival rates is high enough to allow us to reject the assertion of the Telegraph article that chivalry was dead in 1912?
To answer this question, we need more analysis. R really shines when data are well organized, as done here — when good data engineering is performed. With the prop.test() command, R can run a test if the survival rates for women and men differ significantly. The syntax only requires the values for four arguments:
the number of female survivors,
the number of male survivors,
the number of total female passengers, and
the number of total male passengers.
These values have been calculated already and stored in the R Objects WomenSurv, MenSurv, WomenTotal, and MenTotal. We can provide these values to the prop.test() command grouped as two R vectors, one for the survival numbers and one for the total numbers for women and men, respectively:
Above, we saved the output of the prop.test() command in an R object named ModelPropFemaleVsMale. We started the object name with the word Model to indicate that it stores the output of a statistical model. ModelPropFemaleVsMale is a complex object. However, when we print it with the print() command, we extract only important information from the model object:
##
##  2-sample test for equality of proportions with
##  continuity correction
##
## data:  c(FemSurv, MaleSurv) out of c(FemTotal, MaleTotal)
## X-squared = 258, df = 1, p-value <2e-16
## alternative hypothesis: two.sided
## 95 percent confidence interval:
##  0.4913 0.6124
## sample estimates:
## prop 1 prop 2
## 0.7420 0.1902
Reading the output above backward, starting with the last line, allows us to develop the final result step-by-step. The last line from the ModelPropFemaleVsMale object shows the different survival rates for female (Prop1) and male (Prop2) passengers. The difference between these two survival rates is about 0.55. The 95%-confidence interval for the difference ranges from 0.49 to 0.61. The probability of this difference being zero (both survival rates would be the same) is expressed by the P-value in Line 6 of the output. As the P-value shows, the probability for the female and the male survival rate to be the same is almost zero.
We can summarize:
The assertion from the Telegraph that chivalry was dead in 1912 during the Titanic disaster is most likely not correct.
Now, you should be ready to pursue another small project with minimal guidance (no Hints in the code block below). How about you analyze the different survival rates depending on if passengers traveled in first, second, or third class?
First, create, based on the data frame DataAnalysis, three data frames containing only passengers in classes 1, 2, and 3, respectively. The object names followed by ... are already provided in the R code block below.
Next, substitute the ... in lines 5 – 7 with the appropriate R code to calculate the survival rates for each of the three travel classes (note that the data frame DataAnalysis has already been loaded in the background):
DataClass1= ...
DataClass2= ...
DataClass3= ...

Class1SurvRate= ...
Class2SurvRate= ...
Class3SurvRate= ...

cat("Survival rate in class 1:", Class1SurvRate)
cat("Survival rate in class 2:", Class2SurvRate)
cat("Survival rate in class 3:", Class3SurvRate)
Happy Analytics!
3.11 🧭Exercises: Working with R
Interactive Section
In this section, you will find content together with R code to execute, change, and rerun in RStudio.
The best way to read and to work with this section is to open it with RStudio. Then you can interactively work on R code exercises and R projects within a web browser. This way you can apply what you have learned so far and extend your knowledge. You can also choose to continue reading either in the book or online, but you will not benefit from the interactive learning experience.
To work with this section in RStudio in an interactive environment, follow these steps:
Ensure that both the
learnRand theshinypackage are installed. If not, install them from RStudio’s main menu (Tools -> Install Packages \(\dots\)).Download the
Rmdfile for the interactive session and save it in yourprojectfolder. You will find the link for the download below.Open the downloaded file in RStudio and click the
Run Documentbutton, located in the editing window’s top-middle area.
For detailed help for running the exercises including videos for Windows and Mac users we refer to: https://blog.lange-analytics.com/2024/01/interactsessions.html
Do not skip this interactive section because besides providing applications of already covered concepts, it will also extend what you have learned so far.
Below is the link to download the interactive section:
https://ai.lange-analytics.com/exc/?file=03-RAndRStudioExerc200.Rmd
The following sections will allow you to review and extend what you have learned so far. If you need help with any excises, return to the corresponding section above.
Character Data Type
In the first set of exercises, you will work with character Data Types.
Exercise 1:
The simplest way to use character Data Types is to print them, like in the following exercise:
- Your turn:
-
Why don’t you change the text and print again?
Exercise 2:
You can also assign characters to an R object, which then becomes an R character-object, and you can print it afterward:
- Your turn:
-
Change the sentence and print it again. What happens if you forget the quotes?
Exercise 3:
Instead of using print() to output R objects to the Console, you can use the cat() command (cat stands for concatenate). This command allows combining text and R objects as long as they are separated by comma:
- Your turn:
-
Assign your own first name to the R object
FirstNameand rerun the code.
Numerical Data Type
In the following exercises, you will assign numerical values to R objects and work with numerical objects and values.
We can assign a value to an R object using the “=”-sign. Remembering to interpret the “=”-sign as “assigned to” rather than an “equal to” sign like in algebra is important.
As mentioned before, an alternative to using the “=” symbol is the “<-” symbol. The latter emphasizes an assignment rather than an equality. However, throughout this book, we will use the “=”-symbol for simplicity, keeping in mind that it stands for assigned to.
Exercise 4:
Below you find an example of how to assign a value of \(23\) to a variable called \(A\), and then add \(100\) to this value:
Look carefully at Line 2 of the exercise. Given that A=23 from Line 1, Line 2 does not mean that A equals A+100. Otherwise, considering Line 1: 23=23+100 — which is clearly not the case.
The correct way to interpret Line 2 is as an assignment. We assign a new value to A, which is 100 greater than the old value of 23.
- Your turn:
-
- Execute the code as is and explain it.
-
- Assign a value 33 to
Ain Line 1 of the code and then use Line 2 to double the value.
- Assign a value 33 to
Exercise 5:
We can perform algebraic calculations with numbers or numerical R objects. Below is an example:
A=2
B=4
A=500*A/10
C=A*B
cat("R object C contains the product of A and B. Therefore, C is:", C)
D=sqrt(A)
cat("The square root of ", A, " is:", D)- Your turn:
-
- Run the code and then carefully check the calculations above.
-
- Explain why the value of C is \(400\) and not \(8\).
-
- Finally, change the value that is assigned to
Ain Line 1. The goal is to create an output from thecat()command in Line 7 that reads:The square root of 400 is: 20
- Finally, change the value that is assigned to
Exercise 6:
In the code block below, you are tasked to calculate the area of a rectangle based on its length and width.
- Your turn:
-
Use the two R objects
LengthandWidth, assign values to these objects (e.g., 4 and 3), and then calculate the area of the related rectangle. The code is partially provided already. You just need to replace the...with your code additions.
Logical Data Type
The following exercises cover logic R objects. We will assign TRUE and FALSE to different objects and combine them with & (AND) and | (OR) to see the result. We will also perform calculations with logic R objects. Remember that TRUE stands (internally) for \(1\) and FALSE for \(0\).
Exercise 7:
Below TRUE is assigned to two logical R objects. These two R objects are combined with an AND (&), saved into another logical R object, and then printed to the Console with the cat() command:
Run the code above, and you will see that the result for IsHappy is TRUE. This is because we require for happiness (IsHappy) that life is good and that the person is in a good mood. Both were the case; therefore, the result was TRUE for IsHappy.
- Your turn:
-
Assume that life is still good, but the person’s mood changes from good to not-good. Change
TRUEandFALSEaccordingly. What happens to the person’s happiness (IsHappy) when you execute the new code? Explain.
Exercise 8:
Here is an example for OR (|):
IsWeatherDry=TRUE
IsIndoor=FALSE
IsStayingDry=IsWeatherDry | IsIndoor
cat("Person stays dry:", IsStayingDry)
If the weather provides sunshine or a person is indoors, the person will not get wet from rain and will stay dry. Only one of the two logical objects needs to be TRUE to generate a TRUE for IsStayingDry.
- Your turn:
-
- Run the code above and explain the result.
-
- Find a similar example, rename the R objects, change the text in the
cat()command accordingly, and rerun the code.
- Find a similar example, rename the R objects, change the text in the
Exercise 9:
Below is a more complex example of a person that can be exposed to dry weather (or not) and is indoors (or not) with an intact roof (or not).
IsWeatherDry=FALSE
IsIndoor=TRUE
IsRoofIntact=FALSE
IsStayingDry=IsWeatherDry | (IsIndoor & IsRoofIntact)
cat("Person stays dry:", IsStayingDry)- Your turn:
-
- Run the code and explain the result related to the code.
-
- Predict what would happen to the result if the roof was intact.
-
- Change the code for an intact roof, execute, and explain the result.
Vector-Objects
You already learned that a sequence of numerical, character, or logical objects is called a vector object.
For the following exercises, we created four related vector objects: VecFirstNames to store the first names of three persons, VecAges for their age, VecIsFemale to indicate if their sex is female (or not), and VecNumKids for the number of children they have. To assign values to the vector objects, we use the c() (combine) command:
VecFirstNames=c("Carsten", "Jose", "Jane")
VecAges=c(45,54,23)
VecIsFemale=c(FALSE,FALSE,TRUE)
VecNumKids=c(1,2,1)
The four vector objects are related because we used the same order for their values. The first value belongs to Carsten, the second value belongs to Jose, and the third to Jane. Therefore, we can deduce Jose is 54 years old, his sex is male (FALSE for IsFemale), and he has two kids.
It is a little cumbersome that we always have to track the order of elements to interpret the vector values correctly. Fortunately, this gets much easier when we use data frames in the following exercise section.
For now, we just assume the order in each of the three vectors is the same and see what we can do with the vector-objects.
Exercise 10:
In this exercise, you will calculate some crucial statistics from our vectors.
- Your turn:
-
Substitute the
...in the code below and run the code: -
- Calculate the number of persons in the dataset and store the result in
NumOfPersons.
- Calculate the number of persons in the dataset and store the result in
-
- Calculate the number of women in the dataset and store the result in
NumOfWomen.
- Calculate the number of women in the dataset and store the result in
-
- Calculate the number of men in the dataset and store the result in
NumOfMen.
- Calculate the number of men in the dataset and store the result in
-
- Calculate the proportion of women in the dataset and store the result in
PropWomenin digital format.
- Calculate the proportion of women in the dataset and store the result in
-
- Calculate the proportion of men in the dataset and store the result in
PropMenin digital format.
- Calculate the proportion of men in the dataset and store the result in
Note that the vector objects VecFirstNames, VecAges, VecIsFemale, and VecNumKids have already been loaded in the background.
AvgAge=mean(VecAges)
NumOfPersons=length(...)
NumOfWomen=...(...)
NumOfMen=NumOfPersons-...
PropWomen=...(...)
PropMen= 1 - ...

cat("We have", NumOfPersons, "persons in the dataset",
    "with an average age of", AvgAge, ".")
cat("We have", NumOfWomen, "female(s) and", NumOfMen, "male(s).")
cat(round(PropWomen,2)*100, "% are female and",
    round(PropMen, 2)*100, "% are male.")
Exercise 11:
In this exercise, you will perform numerical calculations on a vector. For the sake of this exercise, assume the current year is 2024. Of course, you can change this in the interactive exercise if you wish.
CurrentYear=2024
VecFirstNames=c("Carsten", "Jose", "Jane")
VecAges=c(45,54,23)
VecBirthYears=CurrentYear-VecAges
cat("Birth years for", VecFirstNames, "are:", VecBirthYears)
## Birth years for Carsten Jose Jane are: 1979 1970 2001Run the code to estimate the birth years for Carsten, Jose, and Jane. The estimated birth years are calculated as the difference between the current year (the numeric value stored in the R object CurrentYear) and all three values stored in the vector object VecAges. Consequently, the result (VecBirthYears) contains three values and is also a vector object.
- Your turn:
-
- Adjust the
CurrentYearobject to include the current year, if needed.
- Adjust the
-
- Adjust the
vectorobjectVecFirstNamesto include the names of three of your friends.
- Adjust the
-
- Adjust the
vectorobjectVecAgesto include the ages of your three friends.
- Adjust the
-
- Execute the modified code to estimate the birth years of your three friends.
Data Frame Objects
In the previous exercise section, you analyzed the content of different vectors under the assumption that their elements were in the same order. It required remembering the order of elements in a vector when performing analysis, which is cumbersome and can be avoided with data frames.
You can think of a data frame as a table with variables in the columns, variable names in the first row, and related observations in all other rows — just like an Excel table.
The variables in the columns of a data frame are very similar to vector objects — except that they are part of the data frame. In fact, we will show in the following exercises that the columns of a data frame can be populated with vector objects and that columns of a data frame can be extracted as vector objects.
After a data frame object is defined, you can use commands from the tidyverse package to process the data. Throughout this book, we will almost exclusively work with data frames and use the tidyverse for data engineering.
Exercise 12:
Regardless of whether the file is on your computer or the Internet, tabular data in a file can be imported into a data frame with the import() command from the rio package.
When you run the code of the exercise below, the Titanic dataset will be imported to the data frame DataFromInternet, and with select(Survived, Name, Sex), you will create a data frame that only includes the variables Survived, Name, and Sex from the imported Titanic dataset:
library(rio)
library(tidyverse)
DataFromInternet=
  import("https://ai.lange-analytics.com/data/Titanic.csv") |>
select(Survived, Name, Sex)
head(DataFromInternet)- Your turn:
-
Another tabular dataset containing wine observations can be imported from the Internet. The dataset contains 3,198 observations about different wines and was initially developed by Cortez et al. (2009). It includes variables about wine color, several chemical properties, and an indicator for quality. The dataset is available as a tabular file at:
https://ai.lange-analytics.com/data/WineData.rds. -
- Adjust the
import()command to assign the wine dataset to the data frameDataFromInternet.
- Adjust the
-
- Change the
select()command to select only the variables \(wineColor\) (renamed to \(WineColor\)), \(acidity\) (renamed to \(Acidity\)), and \(alcohol\) (renamed to \(Alcohol\)).
- Change the
-
- Execute the modified code.
Exercise 13:
When you run the code below, you will create a data frame DataThreeFriends by manually using the data.frame() command. Since variables (columns) of a data frame are very similar to vector objects, you can use the c() command to create vector objects that populate the variables for the data frame.
library(tidyverse)
CurrentYear=2024
DataThreeFriends=data.frame(FirstName=c("Carsten", "Jose", "Jane"),
                        LastName=c("Lange","Hernandez","Doe"),
                        Age=c(45,54,23),
                        IsFemale= c(FALSE,FALSE,TRUE))
print(DataThreeFriends)
## FirstName LastName Age IsFemale
## 1 Carsten Lange 45 FALSE
## 2 Jose Hernandez 54 FALSE
## 3 Jane Doe 23 TRUE- Your turn:
-
- Change the value for
CurrentYear, if needed.
- Change the value for
-
- Enter the data of three of your friends (two male and one female).
-
- Use a pipe to add a
mutate()command to thedata.frame()command. Then use themutate()command to add a variable \(BirthYear\) that shows the birth years for the three persons in the data frame.
- Use a pipe to add a
-
- Run the code to see the results.
Exercise 14:
Commands like sum() or mean() that we used before to analyze vectors take only vector-objects as input. You cannot use variables from data frames directly. Therefore, to analyze variables in a data frame with commands such as mean() or sum(), you must first extract the data frame variables as vectors before these commands can process them.
Fortunately, this procedure is simple. To extract a variable from a data frame as a vector, you just need to provide the data frame’s name and the variable’s name, separated by a “$”-sign.
The exercise below provides an example of extracting the variables \(Survived\) and \(Age\) from the data frame DataTitanic as a vector object for further processing.
In the code block below, we use DataTitanic$Survived to extract the variable \(Survived\) as a vector and then use this vector object to calculate the vector’s sum(). This sum coincides with the number of survivors in the dataset because a survivor is coded as \(1\) and a non-survivor is coded with \(0\) (note, the data frame DataTitanic has been loaded already in the background):23
NumOfSurv=sum(DataTitanic$Survived)
AvgAgeOfPas=...(...)
cat(NumOfSurv, "passengers survived.")
cat("The average age of the passengers was", AvgAgeOfPas, ".")- Your turn:
-
- Substitute the
...in the code block to extract the variable \(Age\) as avectorobject and then calculate the average age of the passengers.
- Substitute the
-
- Run the code to see the results.
3.12 Digital Resourses
Below you will find a few digital resources related to this chapter such as:
- Videos
- Short articles
- Tutorials
- R scripts
These resources are recommended if you would like to review the chapter from a different angle or to go beyond what was covered in the chapter.
Here we show only a few of the digital resourses. At the end of the list you will find a link to additonal digital resources for this chapter that are maintained on the Internet.
You can find a complete list of digital resources for all book chapters on the companion website: https://ai.lange-analytics.com/digitalresources.html
R and RStudio Download
Here, you will find the links to install R and RStudio. Please remember to install R before you install RStudio. Also, if you upgrade R, uninstall the old version first before installing the new R version.

How to Work with RStudio
This is a 5 min. video chapter called “RStudio Intro” from a YouTube video by Carsten Lange. The video chapter explains the basic function of RStudio. You might want to stop the video after the “RStudio Intro” chapter ends.

DataCamp R Course
This is a course from DataCamp. It introduces the basics of R from the start. The course is an interactive course with exercises.

More Digital Resources
Only a subset of digital resources is listed in this section. The link below points to additional, concurrently updated resources for this chapter.

References
When choosing
New Directory, RStudio will create a new directory for the project directory.↩︎We omit Data Types
rawandcomplex, which are rarely used and are not relevant for this book.↩︎Another term often used in mathematics for this data type is
Boolean.↩︎There is another more flexible R object called a
listthat can store a mix of Data Types in one R object and even can store other lists, but this is outside the scope of this introduction.↩︎The dataset provided here was obtained using the R package
titanic(see Hendricks (2015)).↩︎Note that R did assign the data type
charand notfactorto the variable \(Sex\). This is because R cannot determine that \(Sex\) is a categorical variable. However, a user can use the commandas_factor()from thetidyversepackage to convert \(Sex\) to afactor.↩︎As in the original Titanic dataset, \(Survived\) is stored as a
numericalvariable with \(1\) for a surviving passenger and \(0\) otherwise. It would have been better coding practice to store \(Survived\) as alogicalvariable with valuesTRUEandFALSE(see Section 3.5.1).↩︎If needed, a regular data frame can be converted into a tibble with the
as_tibble()command.↩︎For a more detailed overview of R objects and Data Types refer to Sanchez (2021), Chapter 2.5.↩︎
Alternatives to UpperCamel include lowerCamel, or snake_case (see Wikipedia contributors (2023a) for details).↩︎
“In the United States, a person has an estimated 1:10,000-lifetime risk of being struck by lightning”(Jensen, Thurman, and Vincent (2021)). Therefore, assuming a life span of 75 years and 365.25 days on average per year, the probability of getting struck by lightning on a random day is \(\frac{1}{10,000 \cdot 365.25\cdot 75}=0.00000000365\).↩︎
The reason for not writing out “10 to the power of \(\dots\)” in the mathematically correct way stems from the time when the displays of electronic calculators could only display very simple symbols.↩︎
Note that we combine two
library()commands in one line of code separated by a semicolon.↩︎The purchasing power of a British pound from the year 1912 was about 90.4 British pounds at the beginning of 2023 (see Bank of England (2022)). Multiplying this with the exchange rate for the British pound at the beginning of 2023 ($1.2/Brit. pound) (see Federal Reserve Bank of St. Louis (2023)) gives us the multiplier of 108.5.↩︎
The website History.com (keyword: Titanic) provides a comprehensive article about the Titanic disaster (see History.com (2023))↩︎
See 2.↩︎
The character value “\n” creates a line break in the Console output.↩︎
This procedure would also work if survivors were coded as
TRUEand non-survivors asFALSEin a logic object becauseTRUEis internally coded as \(1\) andFALSEas \(0\).↩︎